Hello Everyone,
I am following an SDL3 GPU playlist and I don’t have visibility into the GPU.
So, I was searching for debuggers for use on Mac. And I need some help attaching the Metal Debugger to SDL3 GPU application.
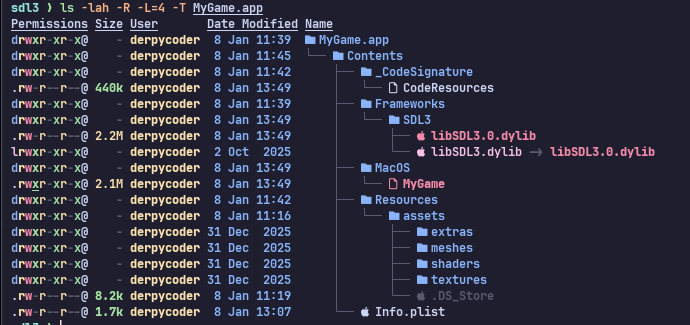
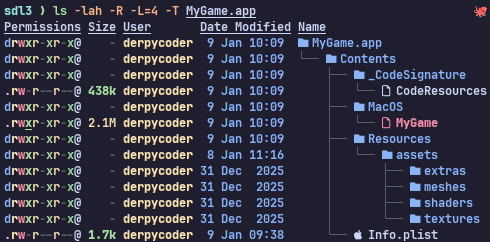
Here’s how it looks: Press Start: Game development on Apple platform
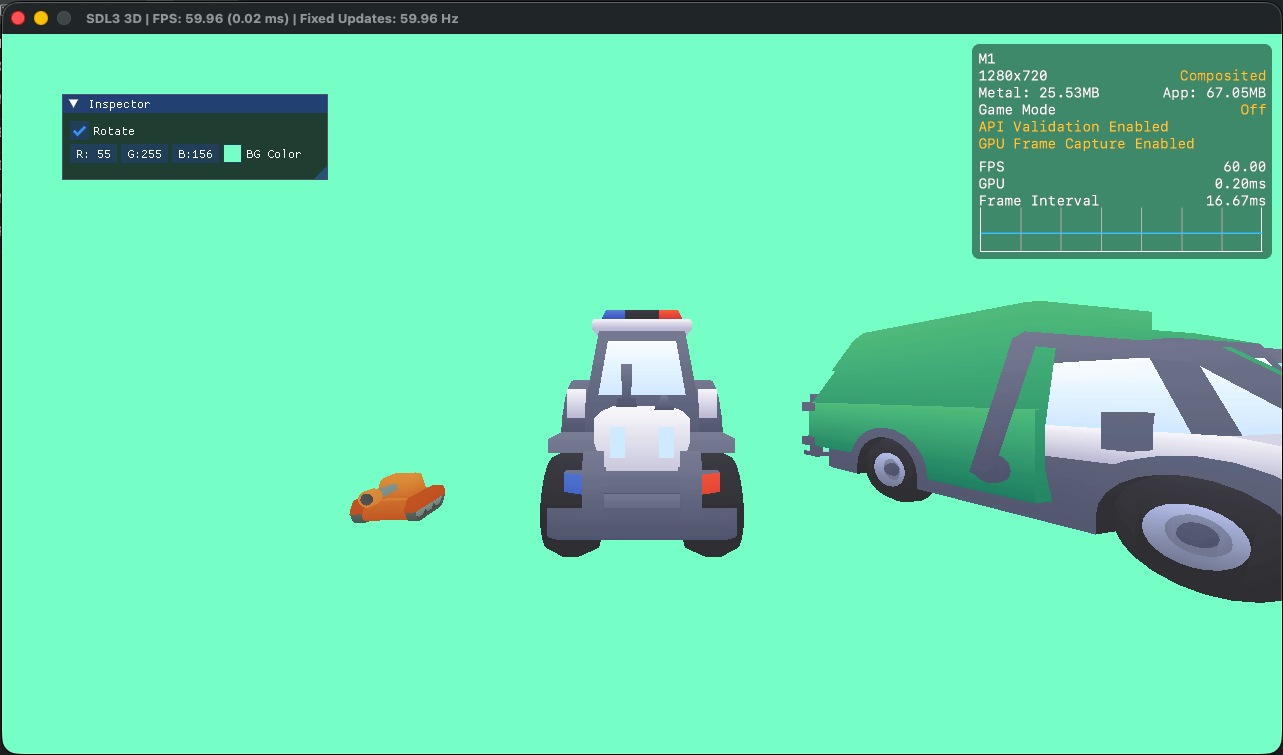
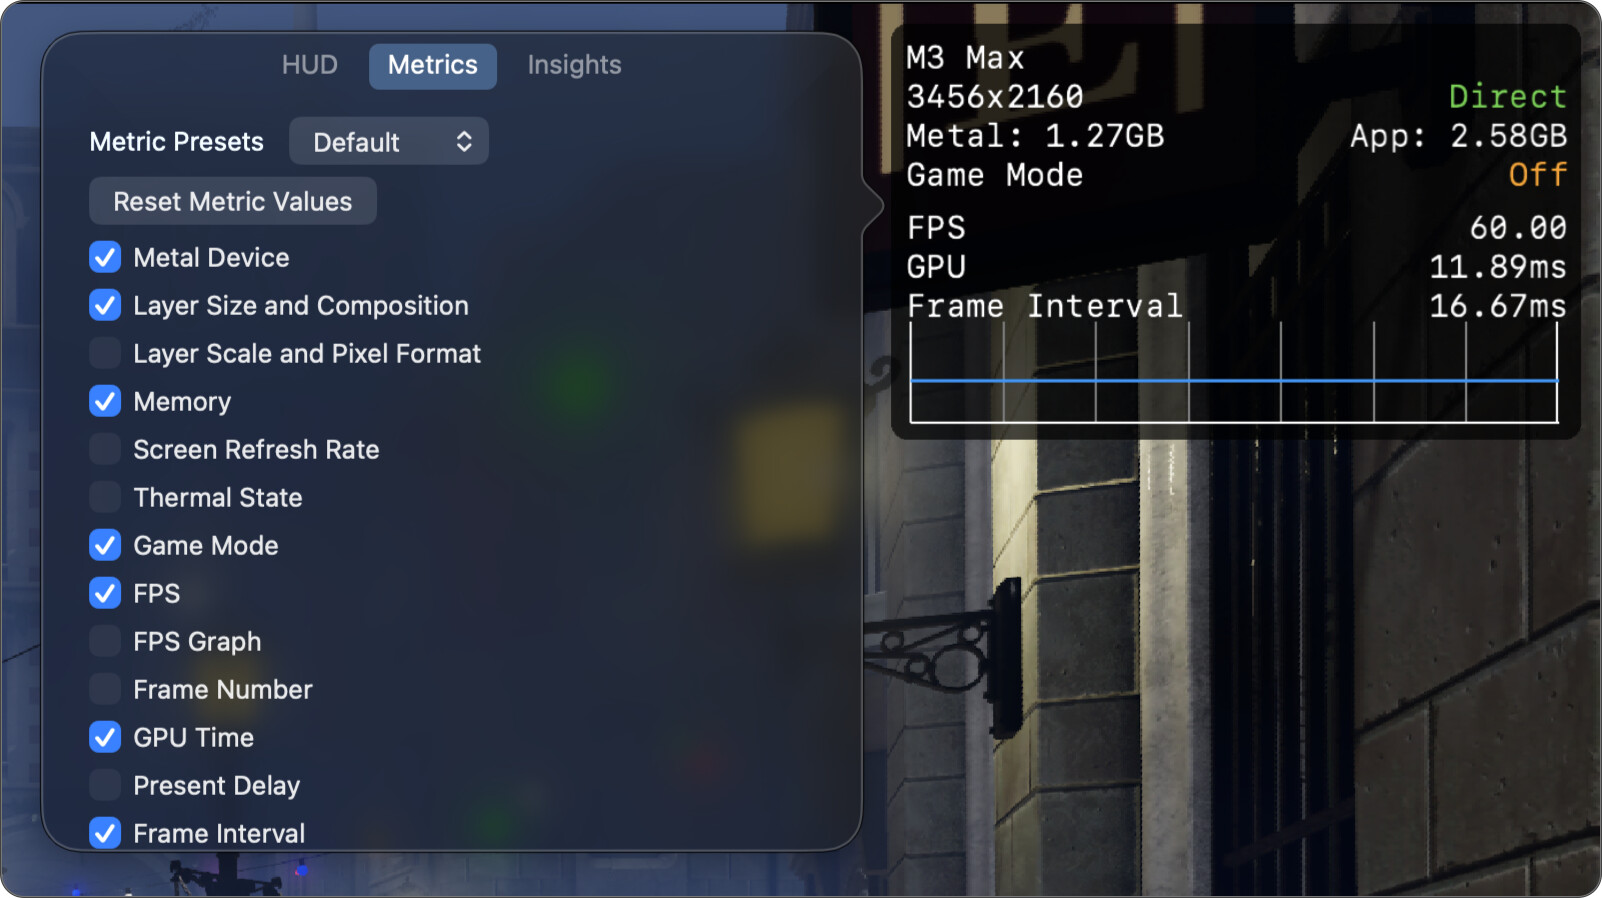
I got the Performance HUD showing with METAL_HUD_ENABLED=1 env variable.
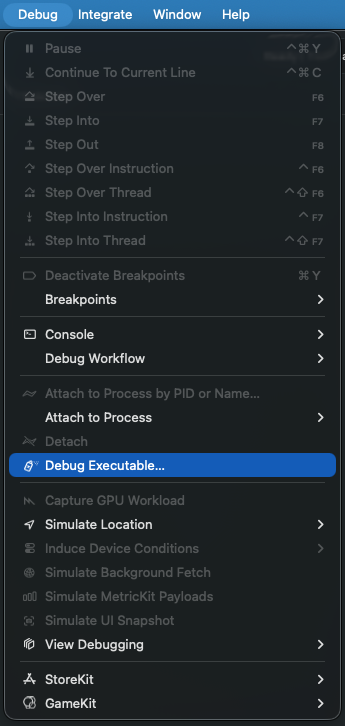
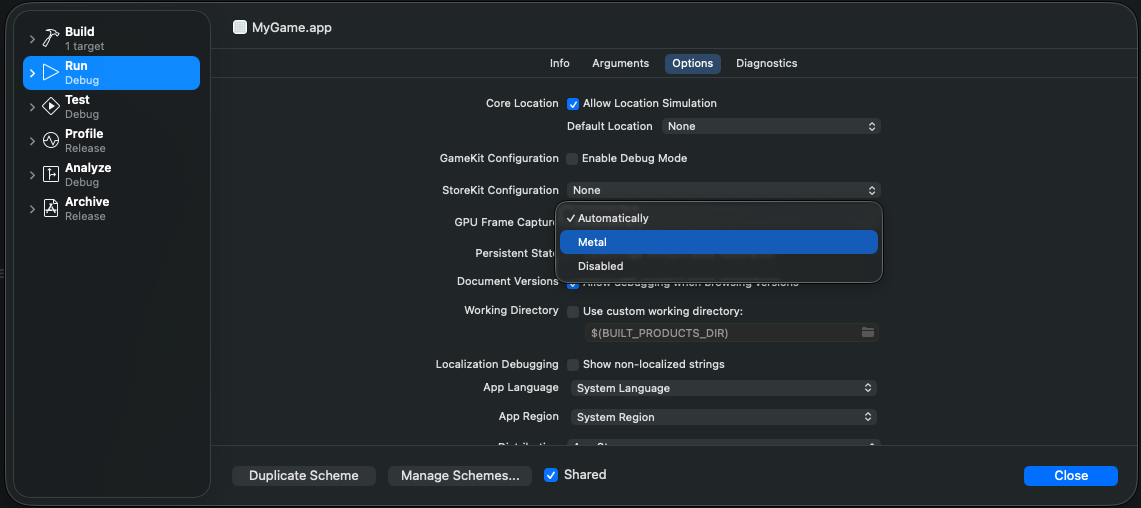
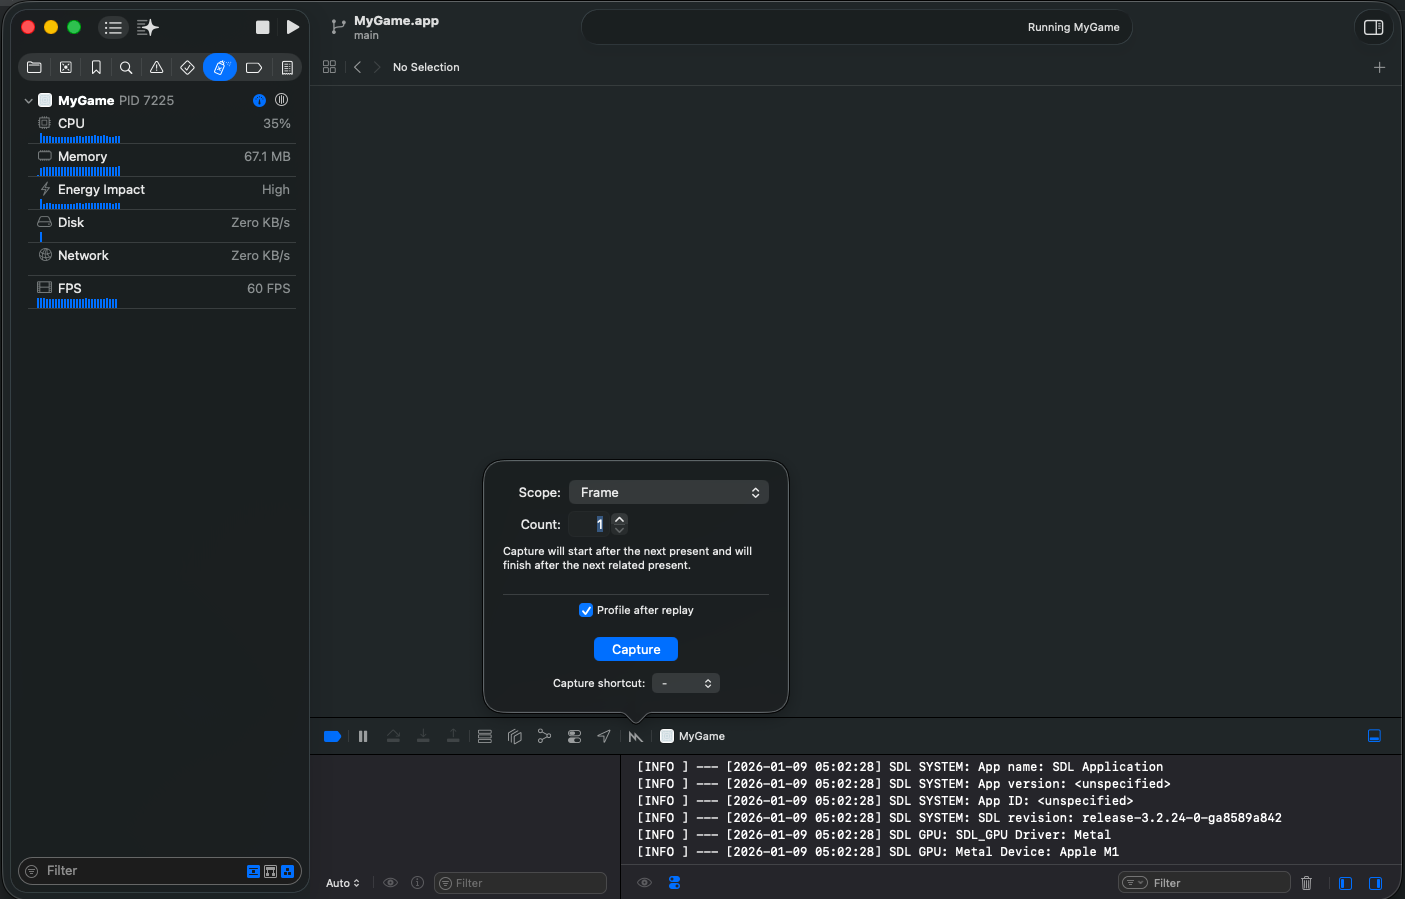
Alas METAL_CAPTURE_ENABLED=1 didn’t work. The HUD said that the capture mode is active. But capture shortcut didn’t work because MacOS blocks that feature for debug builds that are not Xcode built app or something.
—-
Luckily, It can be done programmatically as well: Capturing a Metal workload programmatically.
Here’s a blogpost: How to Capture Metal frame capture outside of Xcode.
—-
So how to do it using Odin or C?
Can someone point me to a working example, it doesn’t have to be Odin, just not Apple Xcode specific stuff or Swift or Objective C.
—-
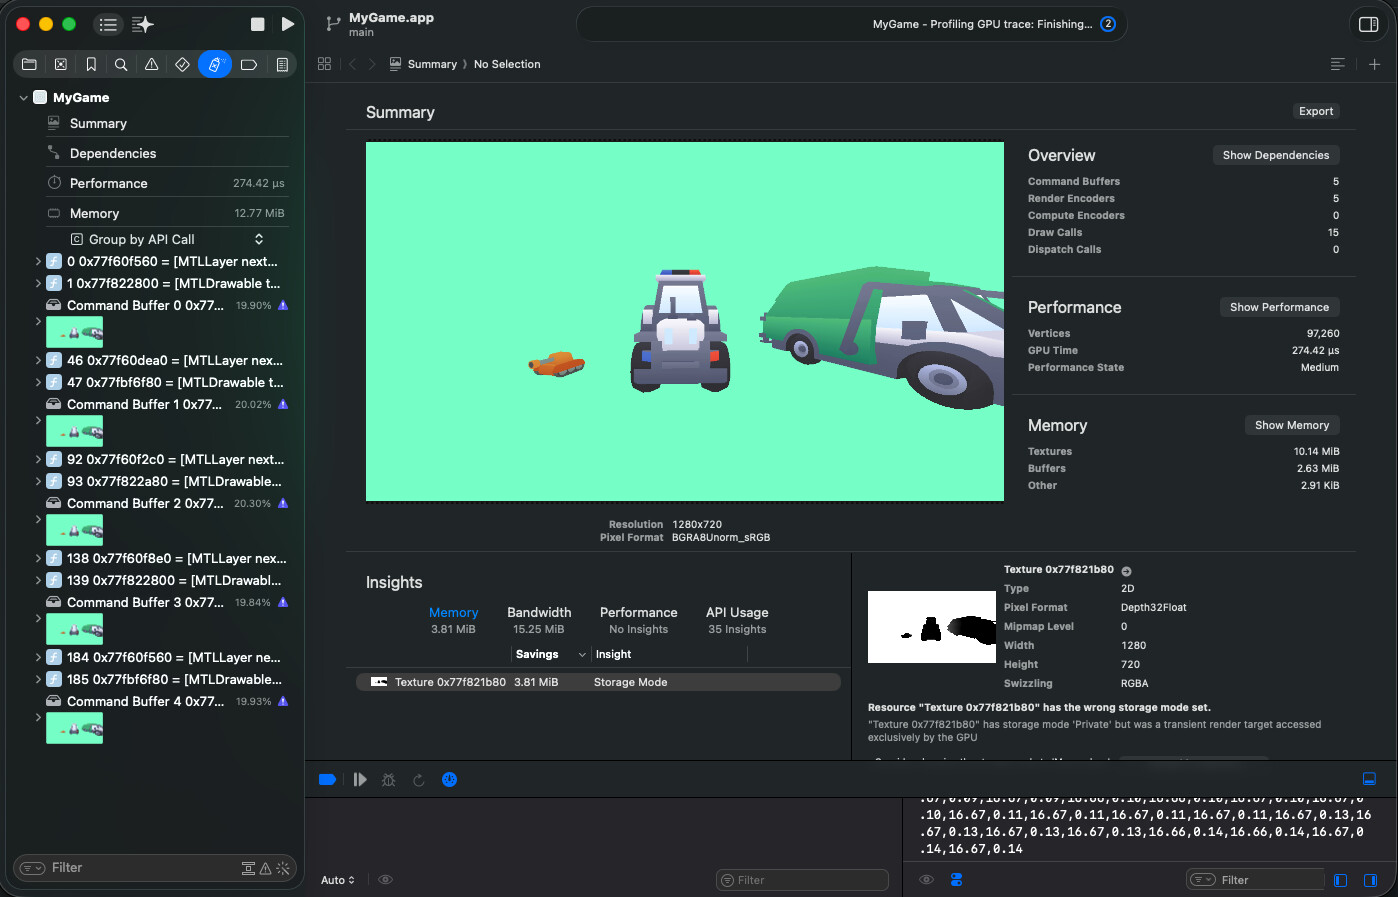
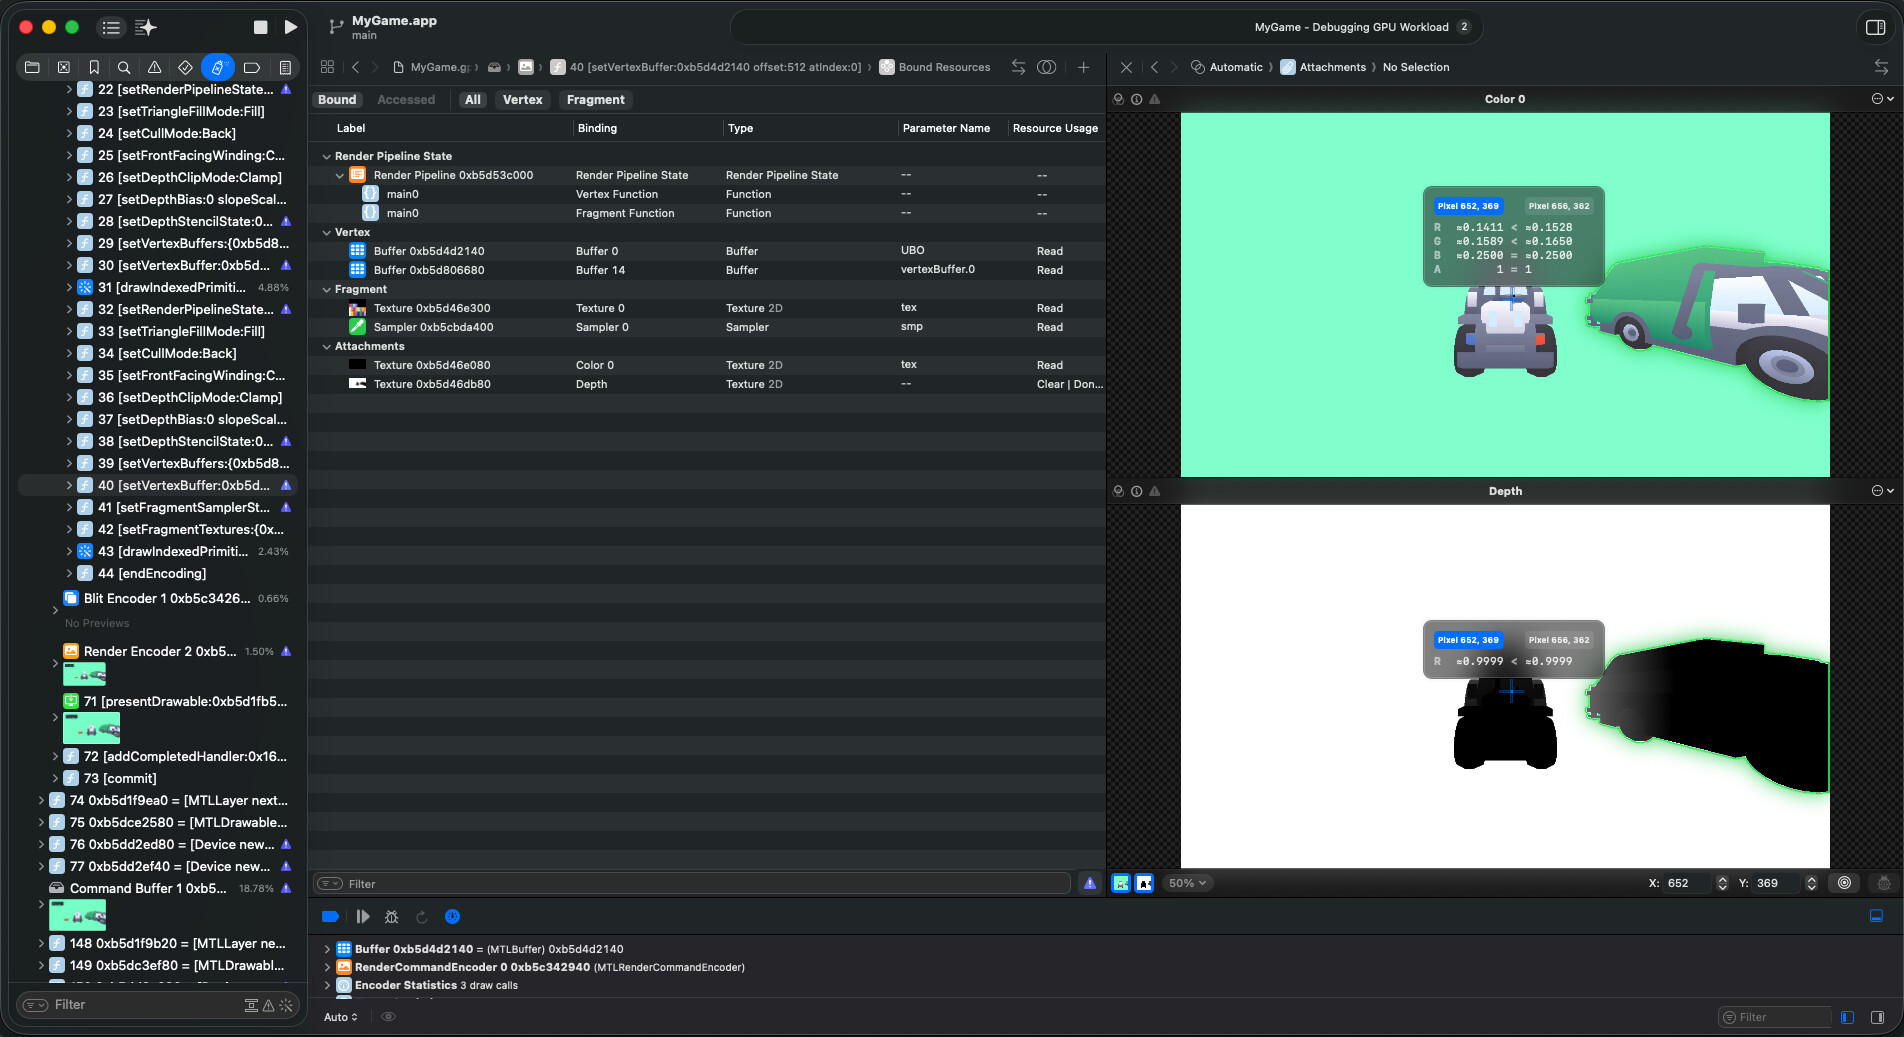
How do you debug and check intermediate GPU changes? There’s no print nothing.
If a big pink background shows up, how do you figure out what’s happening?
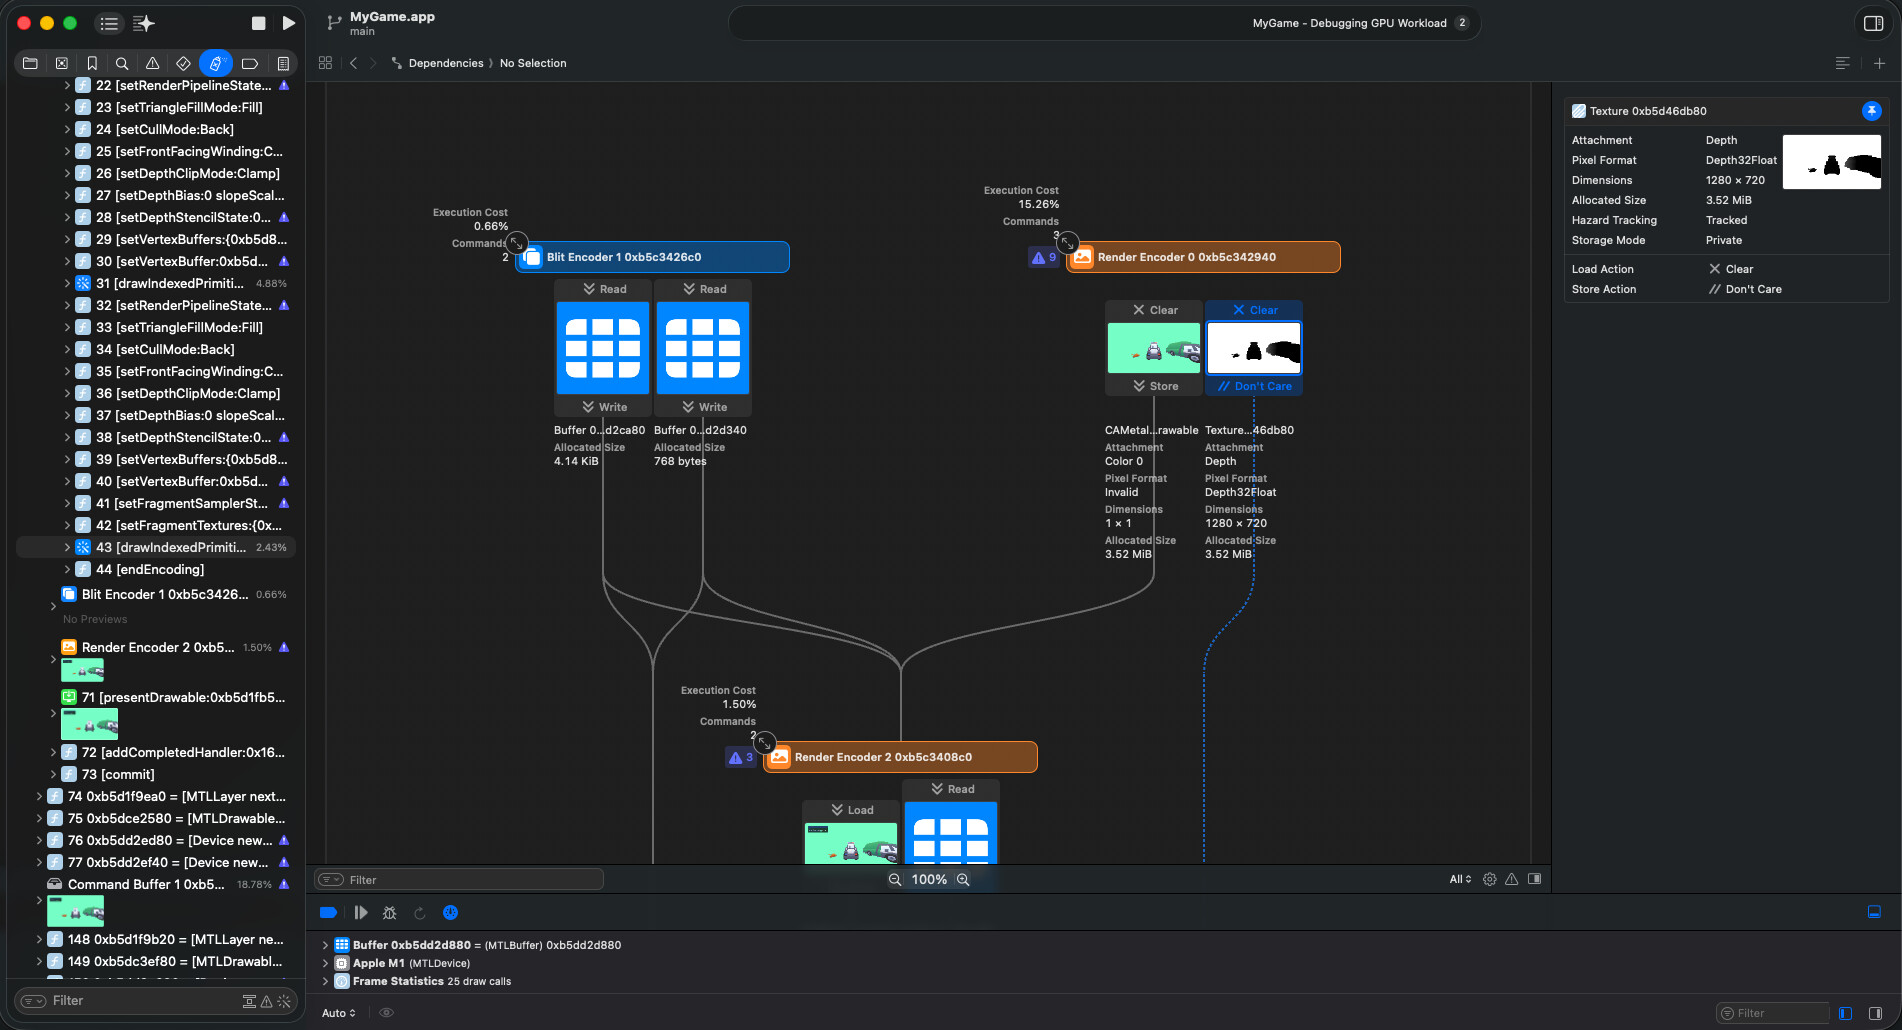
I want to watch the stuff we copy to GPU, see the sets, binds, buffers, transformations happening, NDC view.
Maybe have a view like shader Node editors do, which can show what’s happening after each line of code.
—-
P.S. I don’t know any alternative to Metal Debugger, let me know if there is something else.
P.P.S. There should be more tooling for the low level stuff like web world has.