Memory usage of simple SDL2 program grows linearly

I am a newbie in SDL2 and I was testing an example code of Lazy Foo tutorial just out of curiosity. The program renders an image named x.bmp living in the same folder as the program. Here’s the example program testsdl2.cxx:

/*This source code copyrighted by Lazy Foo' Productions (2004-2022)
and may not be redistributed without written permission.*/

//Using SDL and standard IO
#include <SDL2/SDL.h>
#include <stdio.h>

//Screen dimension constants
const int SCREEN_WIDTH = 640;
const int SCREEN_HEIGHT = 480;

//Starts up SDL and creates window
bool init();

//Loads media
bool loadMedia();

//Frees media and shuts down SDL
void close();

//The window we'll be rendering to
SDL_Window* gWindow = NULL;

//The surface contained by the window
SDL_Surface* gScreenSurface = NULL;

//The image we will load and show on the screen
SDL_Surface* gXOut = NULL;

bool init()
{
  //Initialization flag
  bool success = true;

  //Initialize SDL
  if( SDL_Init( SDL_INIT_VIDEO ) < 0 )
  {
    printf( "SDL could not initialize! SDL_Error: %s\n", SDL_GetError() );
    success = false;
  }
  else
  {
    //Create window
    gWindow = SDL_CreateWindow( "SDL Tutorial", SDL_WINDOWPOS_UNDEFINED, SDL_WINDOWPOS_UNDEFINED, SCREEN_WIDTH, SCREEN_HEIGHT, SDL_WINDOW_SHOWN );
    if( gWindow == NULL )
    {
      printf( "Window could not be created! SDL_Error: %s\n", SDL_GetError() );
      success = false;
    }
    else
    {
      //Get window surface
      gScreenSurface = SDL_GetWindowSurface( gWindow );
    }
  }

  return success;
}

bool loadMedia()
{
  //Loading success flag
  bool success = true;

  //Load splash image
  gXOut = SDL_LoadBMP( "x.bmp" );
  if( gXOut == NULL )
  {
    printf( "Unable to load image %s! SDL Error: %s\n", "03_event_driven_programming/x.bmp", SDL_GetError() );
    success = false;
  }

  return success;
}

void close()
{
  //Deallocate surface
  SDL_FreeSurface( gXOut );
  gXOut = NULL;

  //Destroy window
  SDL_DestroyWindow( gWindow );
  gWindow = NULL;

  //Quit SDL subsystems
  SDL_Quit();
}

int main()
{
  //Start up SDL and create window
  if( !init() )
  {
    printf( "Failed to initialize!\n" );
  }
  else
  {
    //Load media
    if( !loadMedia() )
    {
      printf( "Failed to load media!\n" );
    }
    else
    {
      //Main loop flag
      bool quit = false;

      //Event handler
      SDL_Event e;

      //While application is running
      while( !quit )
      {
        //Handle events on queue
        while( SDL_PollEvent( &e ) != 0 )
        {
          //User requests quit
          if( e.type == SDL_QUIT )
          {
            quit = true;
          }
        }

        //Apply the image
        SDL_BlitSurface( gXOut, NULL, gScreenSurface, NULL );

        //Update the surface
        SDL_UpdateWindowSurface( gWindow );
      }
    }
  }

  //Free resources and close SDL
  close();

  return 0;
}

I compiled this with:

clang++ -std=c++20 -g -fsanitize=address -Wall -Wextra -Wpedantic -Werror -I/usr/include/SDL2 -lSDL2main -lSDL2 testsdl2.cxx -o vimbin

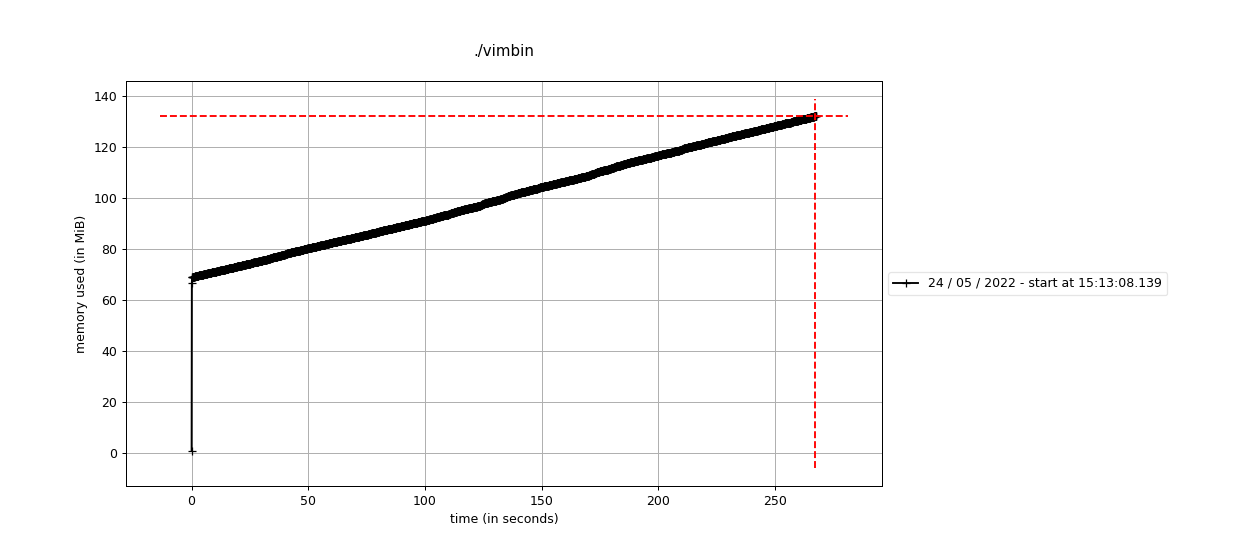
Running the binary shows some memory leaks. Heard that address sanitizer sometimes produces false leaks reports so I decided to profile the memory usage of the binary. Here I am attaching the graph of memory usage:

I am using Ubuntu 20.04 LTS and I installed SDL2 by this:

sudo apt install libsdl2-dev

So what’s wrong with the program? Or is my SDL2 setup wrong? Or is it something wrong with the library itself? How can I get rid of the leaks? Just tell me if additional information is needed.

At this stage, I’m not yet convinced that anything is actually wrong.

Compiling the program myself (and providing my own bitmap file) I get address sanitiser reporting about 76kb of leaks in total (all attributed by address sanitiser to libdbus and my nvidia graphics driver) This isn’t a leak even remotely like what’s suggested by the graph you’ve provided and it doesn’t grow if I let the program run for a longer period of time; it’s just the same ~76kb if I run it for a second or if I run it for five minutes. Does that match what you see?

It’s pretty common to see a couple small leaks around initialisation of a graphics driver or similar. That’s nothing to get too panicky about and it almost certainly has nothing to do with your program itself, especially when it’s the same small amount regardless of how long the program runs.

The other issue is the matter of the graph you’ve shown; you don’t say where the “memory usage” value that you’re graphing is coming from. Is there a strong reason to believe those numbers? Lots of programs (top, free, etc) report memory usage in slightly confusing ways which continue to count memory used even after it has been freed by the process; making a program look like it has a memory leak when it’s actually fine and the memory will all be reclaimed by the OS just as soon as somebody wants it.

As a general rule, if address sanitiser isn’t showing you 70 megabytes of leaked memory when you exit the program after running it for 250 seconds (which I’m not seeing when I try it here), then I’m highly skeptical you actually have the 70 megabyte memory leak suggested by the graph, and think it’s far more likely that the problem is in the data being fed into the graphing tool.

1 Like

@vectorstorm I first detected the unusual growth of memory usage (of vimbin) in system-monitor. Then I used the graphing tool to be sure. This is the tool that I am using.
Usage:

mprof run <binary_name>
mprof plot

To install:

pip install memory_profiler

@vectorstorm Here I have added a 49 seconds screen record called a.mp4 of system-monitor. The original video is about 6 minutes long and I have trimmed parts of it to show the differences quickly. Note that address sanitizer shows only 17 bytes of memory leak while system-monitor shows different result.

(new users cannot upload attachments so had to upload on vimeo)

I feel silly for missing this initially.

The issue is that you’re compiling in address sanitiser mode, so the program is keeping track of every block of memory ever allocated or freed for as long as the program is running so of course its total memory usage is increasing over time, because it’s got more short-lived temporary allocations to track forever the longer the application runs. (this also explains why it starts up using such an absurd amount of memory for a program which is doing so little)

If you remove -fsanitize=address from your compilation command it should return to a normal, flat memory usage.

1 Like

@vectorstorm Thanks a lot. Worked like a charm! No more leaks. I should have understood this in the first place.

It’s not an obvious thing unless you really stop to think about what’s going on under the hood! Even I missed it for a while (because I had done most of my testing not in address sanitiser mode, where everything was fine! It’s just second nature to me to recompile things without address sanitiser once I’ve seen the output once!)

Address sanitiser mode is fantastic as a quick, easy way to check for leaks or write-after-free bugs, but when you’re using it you can’t trust the output of literally any other dev tool, so you always want to get rid of it absolutely as soon as you’re done looking at its output.

1 Like

@vectorstorm Yes. Lesson learnt. Thanks again.